Is ethnic diversity good or bad for economic development? The current evidence largely points to a negative relationship. However, theoretical predictions points to varying impacts of ethnic diversity at different spatial scales. José García-Montalvo and Marta Reynal-Querol test these theoretical predictions through a new systematic strategy in their BSE Working Paper (No. 992), “Ethnic Diversity and Growth: Revisiting the Evidence.”
Current understanding of the impacts of ethnic diversity on economic activity
Studies done relying on cross-country analysis reach a conclusion that greater ethnic diversity has a negative effect on economic development. These findings have supported the view that Africa’s “growth tragedy” is a result of high degree of ethnic diversity in the continent. However, theoretical literature has often emphasized the trade-off between the benefits of diversity and the costs of heterogeneity. On the one hand, ethnic diversity can be beneficial by enhancing productivity through innovation, skill complementarities, or increased creativity, trade, and product variety. On the other hand, diversity can generate an inefficient provision of public goods, ethnically biased policies, and conflict or disagreement over common public goods and policies. In general, these theories imply that there exists a maximum scale or size at which ethnic heterogeneity can be most beneficial i.e. on a smaller scale we should find a positive effect of ethnic diversity and on a larger scale we should find a negative effect.
In this paper, García-Montalvo and Reynal-Querol develop a systematic strategy to study the effect of diversity on growth by analyzing this relationship at different spatial scales. The uniqueness of this study is the use of grid-country cell data which offers flexibility to the authors in testing their hypothesis and the common theoretical predictions at different scales. Previous research has typically relied on political and/or administrative frontiers, or cities/SMA boundaries, to define the unit of analysis.
Luminosity data as a proxy for economic activity
Since many areas of the world do not have information on geo-coded high-resolution measures of economic development García-Montalvo and Reynal-Querol use satellite night light density as a proxy for local economic activity. Satellite night light density data are available from the National Oceanic and Atmospheric Administration and have been used recently by many scholars in various studies. Recent evidence suggests that nighttime lights are an excellent proxy for actual income, while survey means have very little if any, informative content to estimate true income. In addition, population data comes from the Gridded Population of the World. For each cell, the authors construct measures of luminosity per capita which is the basic dependent variable in the regression analysis.
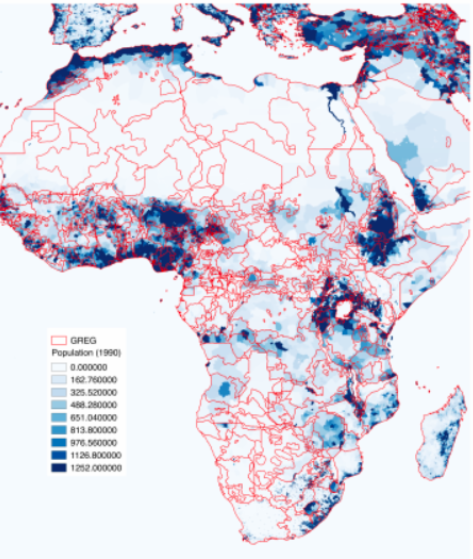
The data for the geospatial location of ethnic groups at the grid level is taken from the data GREG (Geo-referencing of ethnic groups). The full GREG dataset has global coverage and consists of 929 groups. Figure 1 below is a map which shows the ethnic diversity in Africa and neighboring countries. Darker shades of blue indicate greater population density.

Modifiable Area Unit Problem (MAUP)
The theoretical literature points to a positive relationship between diversity and development on a smaller scale and a negative one at a countrywide level. In essence, reasons highlighted are that negative effect of biased policies and institutions at the state level outweigh the benefits of trade and other positive spillovers from the interaction between various ethnic groups. To address this problem called modifiable area unit problem (MAUP), authors design their study to test at different scale sequentially from the smallest grid to countrywide grid.
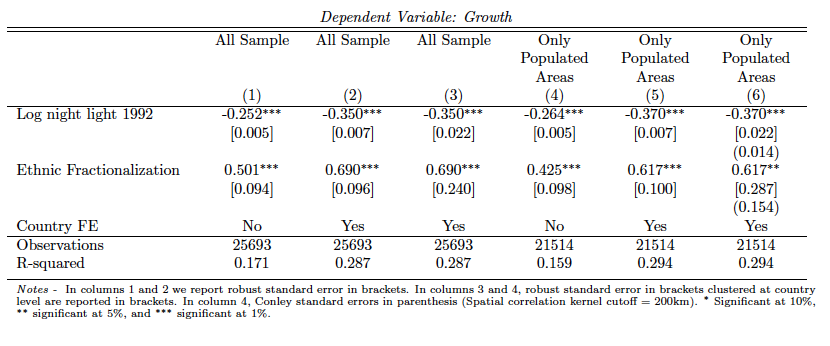
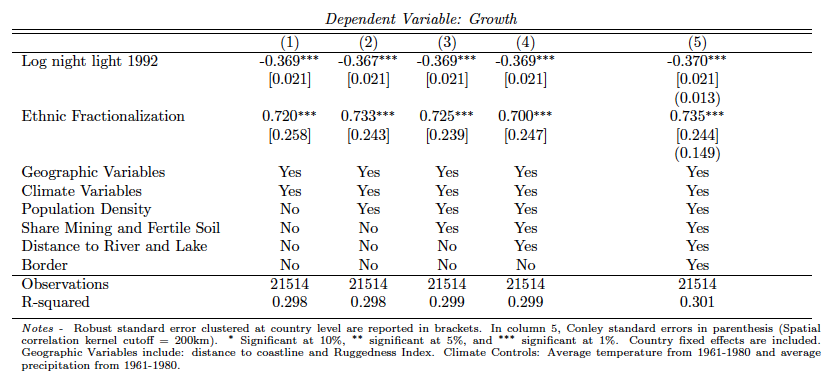
Table 1 below reports the basic result of the paper which provides evidence that there is a positive effect of ethnic diversity on growth at a smaller scale controlling for the country–fixed effect. The magnitude of impact of ethnic fractionalization is of similar size even when including other control variables such as geographical diversity, population concentration and access to natural resources as can be seen in Table 2.


The results are robust to a large number of other potential issues such as to a random change in the initial location of the point that defines, together with the level of resolution, the exact location of the area covered by each cell. Garcia-Montalvo and Reynal-Querol also show that the positive effect of heterogeneity on economic growth is not due to urban area, nor is it simply capturing an agglomeration effect.
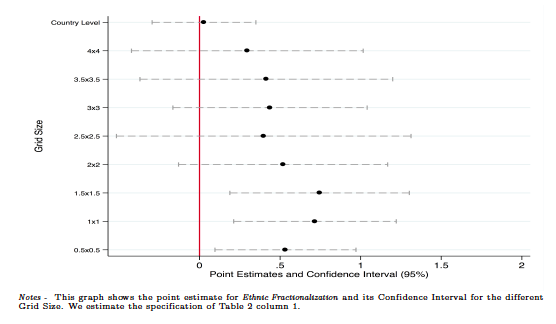
However, it should be noted, in their analysis, reducing the degree of resolution of the grid decreases the association between ethnic diversity and development, to the point of finding no association between heterogeneity and development. This can be noticed in Figure 2 below.

Trade, markets and ethnic diversity
The authors make a convincing case for their results above using the example of the continent of Africa which exhibits extremely rich patterns of ethnic diversity (Figure 1). They rely on findings of historians and anthropologists who have found that markets for trade of goods among different ethnic committees are formed around the boundary of their respective regions under control. Consequently, more markets exist with greater ethnic diversity in a particular region. Since, ethnic communities tend to specialize as noted by previous studies, greater diversity facilitates increased gains from trade. Ethnic groups that are geographically close to one another may, therefore, have a large volume of trade despite their different ethnic origins. In order to provide evidence of this potential mechanism, the authors show that local markets in Africa are located close to ethnic borders, supporting this interpretation.


