One of the key questions in economics is to understand differences in economic development across countries, that is, what makes countries rich or poor. To this aim, economists have focused on studying productivity using aggregate data at a country level. However, even within a country, productivity varies a lot across firms, and this rich heterogeneity does have important consequences for aggregate statistics. Unfortunately, due to a lack of comprehensive and comparable data, there is still little evidence about the role of firms explaining a country performance. A trade-based approach may help to circumvent this lack of data, since in a globalized world, firms from all countries can compete in all destinations. Observing sales of firms from different countries in a single market can explain how firm characteristics determine the export performance of these countries.
In their BSE Working Paper No. 1047, Firms and Economic Performance: A View from Trade, Alessandra Bonfiglioli, Rosario Crinò and Gino Gancia fill the aforementioned gap by using United States import data to estimate the productivity and quality of exporting firms from over 100 countries. More precisely, they use transaction-level data on US imports in 2002 and 2012 containing information on prices, volume, and the identity of exporting firms. The data comprises 1,350,574 observations at firm-product-year level belonging to 366 manufacturing industries and 104 origin countries.
Quality and product appeal
Using recent advances in trade theory, the authors can map the market shares captured by each country into the characteristics of the underlying firms. Under some mild assumptions on the demand for products, it is possible to decompose market shares into the contribution of the number of different exported varieties, average appeal of a product (i.e., its quality-to-price ratio), and deviations from this average. The number of products, the average appeal, and the heterogeneity determine in turn the distribution of the total value of imports across all source countries and sectors. Moreover, assuming that in the same industry firms compete in prices, the authors can identify the mapping between variation in efficiency and in prices, and hence decompose product appeal by quality and efficiency.
The first result of this analysis is that dispersion in firm-product appeal roughly explains half of the cross-country variation in average sales per product and a quarter of total sales. By decomposing this effect, the authors find that quality is the main driver of product appeal. A plausible explanation behind this finding is that the dispersion could be driven by top firms that dominate the trade of the origin country. However, the authors find that the presence of top firms (or superstar firms) explains only about 5% of the variation in total sales.
Firm heterogeneity and per-capita GDP
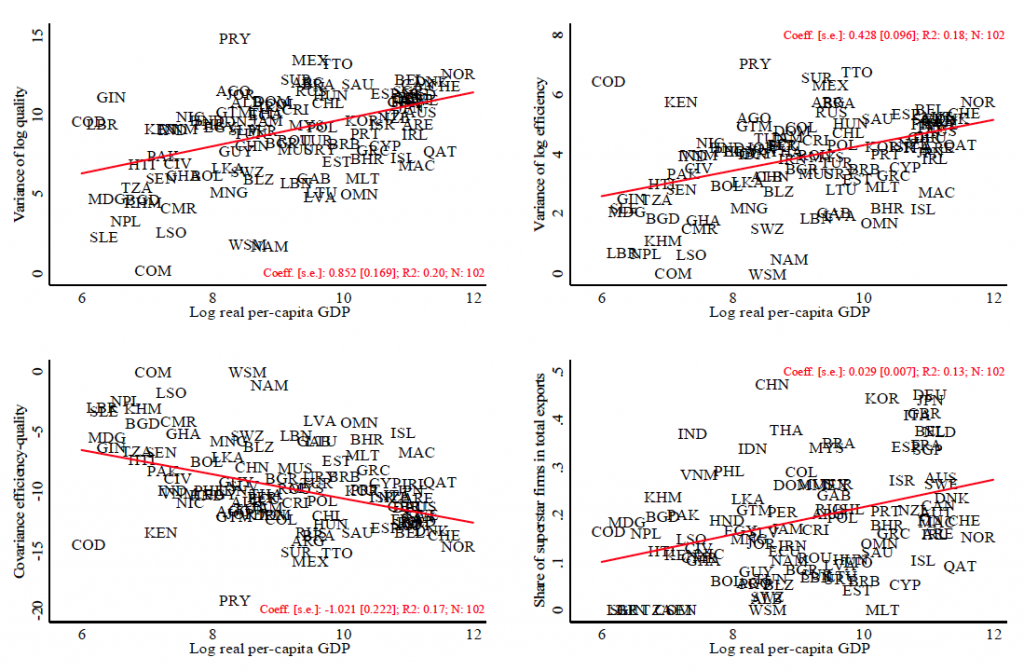
The authors then investigate whether characteristics of the origin country, such as its market size and level of development are systematically related to the dispersion across firms’ attributes. Figure 1 shows how real per-capita GDP of the origin country correlates with the dispersion of quality, the dispersion of efficiency, the covariance between efficiency and quality and the share of superstar firms in total exports.
The main lesson of Figure 1 is that the dispersion of both the quality and the efficiency of the firm-product are positively correlated with real per-capita GDP. This means that richer countries are characterized by more heterogeneity in firms’ quality and efficiency. These two attributes are in turn negatively correlated, that is, products with higher quality are more costly to produce. The richer the country is, the more negative this relationship gets, suggesting that richer countries specialize in high-quality products. Finally, a larger share of superstar firms in total exports in an origin country is positively associated with the economic development of the country.

Variance and covariance components are computed as in eq. (7), separately for each country-industry- year triplet. The variance components are the products between the variance and the square of the elasticity of substitution minus 1. The covariance component is equal to twice the covariance, times the square of the elasticity of substitution minus 1. All graphs use the reg. contr. estimate of the elasticity of substitution. Superstar firms are defined as firms whose total exports to the US in a given year are at least two standard deviations above the average exports for their country-industry-year triplet. Each graph plots the country-level average of the corresponding variable on the log of average real per-capita GDP between the years 2002 and 2012.
Conclusions
The main lesson we can draw from this analysis is that heterogeneity in firms’ attributes, quality and efficiency, plays an important role in explaining the countries’ economic performance. A role that could not be previously identified by using aggregate statistics. From a policy perspective, the results point towards a so far unexplored benefit of market size: larger markets host more diverse firms and appear as a more fertile ground for superstar firms. From an academic perspective, the findings point out to an important direction for further research: the identification of the mechanisms that might be generating firm heterogeneity and the way in which these mechanisms evolve across countries’ economic development.


