This research was a candidate for the Vanguard of Science Prize, organized by La Vanguardia newspaper.
In their BSE Working Paper (No. 888) “Growing like Spain: 1995-2007”, Manuel García-Santana, Enrique Moral-Betino, Josep Pijoan-Mas and Roberto Ramos postulate that the Spanish remarkable economic growth between 1994 and 2007 occurred mainly due to factor accumulation as opposed to productivity gains. In fact, Total Factor Productivity (TFP) presents an average yearly decrease in the mentioned period. The authors show that the negative TFP growth was caused by the increase in the within-industry misallocation of production factors.
The Spanish 1995-2007 growth experience
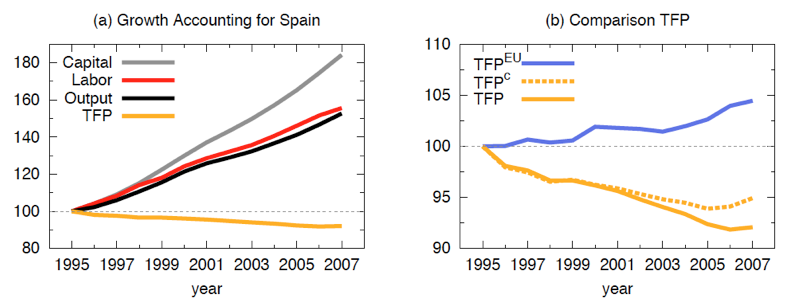
From 1995 to 2007, Spanish GDP grew at an average of 3.5% per annum, considerably above the EU average for the same period (2.2%). Despite such economic performance, annual TFP growth was -0.7%, which is low in comparison to that of the US (+0.6%) and the EU (+0.4%) over the same period. A standard growth accounting exercise reveals that the GDP growth was a consequence of factor accumulation (labor and capital), as is evidenced in Panel (a) of Figure 1 below.

Notes. Panel (a) shows the actual evolution of labor, capital, output and TFP during the period 1995-2007. Panel (b) shows the actual evolution of TFP in Spain (solid yellow line) and the EU (solid blue line), and the counterfactual evolution of TFP in Spain if sectoral shares had remained constant to their values in 1995 (dashed yellow line). The source for all the series is EU-KLEMS.
Misallocation of factors and productivity: methodology
The following different methods were used to identify the cause of the decrease in TFP: (i) determination of the dispersion of productivities across firms in the same sector (a measure of misallocation of resources), (ii) calculation of the counterfactual TFP under the assumption that misallocation remains the same level as it was in 1995, (iii) decomposition of sectoral productivity growth into four different sources: within-firm, between-firm, cross-term, entry/exit and (iv) usage of the variation in allocative efficiency across regions of Spain and the variation in sectoral characteristics.
The authors use a Spanish database of non-financial companies from 1995 to 2007, which tracks an average of 497,782 firms per year. For each firm, revenue, wage costs, employment, book value of capital stock, expenses in intermediary goods and sector of activity can be observed. The sample provides an accurate representation of the Spanish firm size distribution.
Main findings
The following results from the aforementioned analysis are stated as per each of the methods used:
- In an undistorted economy, all sectors would equate their marginal revenues to factor prices, which would imply a sectoral dispersion of average factor products of zero. The authors found a within-sector variation in the marginal revenue for both capital and labor in Spain during the period between 1995 and 2007, which necessarily follows from variation in firms’ distortions.
- The authors report a yearly increase in potential TFP gains from removing misallocation in the overall economy, with greater improvements observed for the construction sector, followed by services, trade and manufacturing. A counterfactual analysis of TFP growth rates is also performed, keeping misallocation at its 1995 level. Findings point to an annual TFP growth rate averaging +0.8% assuming constant misallocation.
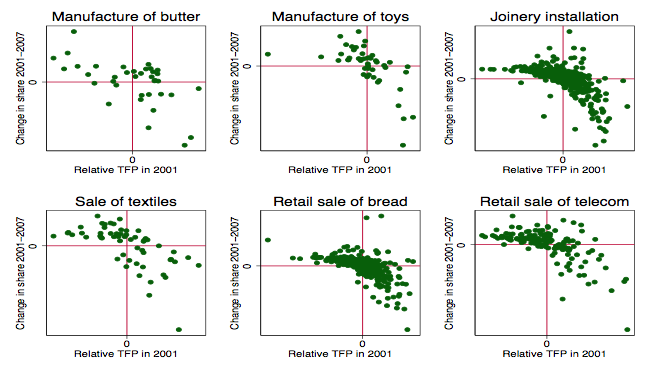
- Within-firm, cross-term and net entry components were found to contribute positively to TFP growth. In contrast, the between-firm component -which reflects reallocation of resources across firms within a sector- contributed to the overall decline in TFP. This component being negative is reflected by the fact that firms’ growth during this period was inversely related to initial productivity. That is, during the boom years, low productivity firms were assigned more capital and labor than high productivity firms. As a result, the former outgrew the latter. Figure 2 displays this pattern for a selection of 6 industries, but this result is widespread across most industries.

Notes. Relative TFP refers to the logarithm of firm-specific TFP relative to the industry average. Change in share refers to the difference in firm-specific market share measured in terms of value added.
- Finally, the authors found that neither regional differences nor variation in sectoral characteristics such capital structures intensity, skill intensity, financial dependence, tradability or innovative content are unrelated to changes in allocative efficiency between firms. Nonetheless, authors make a strong case for the existence of a crony capitalist system, as they find that industries in which the influence of the public sector is most important for success present twice as big productivity losses as in the remaining sectors. The potential TFP annual growth of 0.3%, had all industries behaved competitively during the analyzed period, is a telling evidence of the costs of crony capitalism.
Conclusion
Spanish growth between 1994 and 2007 was based on the factor accumulation that occurred despite an average annual decrease in productivity (as measured by the TFP). This paper claims that the mentioned decline stems from within-sector misallocation of production factors across firms. Furthermore, there is evidence that the industries that experienced more severe misallocation were those in which public sector influence is most crucial for business development.
Specifying the channels through which public sector influence might contribute to resource misallocation is yet to be addressed.


