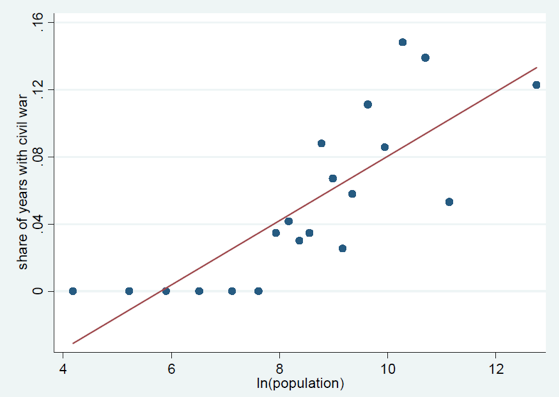
The most frequently used dataset in the conflict literature is the UCDP/PRIO Armed Conflict Dataset, which uses two thresholds of 25 and 1000 battle related deaths to define dummy variables indicating civil conflict. Intuition suggests that a more populous state is more likely to reach the specified thresholds with relative ease, a suspicion which is also borne out in the data as can be seen in Figure 1.

The standard model versus the per capita model
Up until recently there has been little debate about these absolute thresholds. Now Hannes Mueller initiates the debate in his BSE Working Paper (March 2014) “Growth and Violence: Argument for a Per Capita Measure of Civil War.” His article sheds light on the assumptions behind the standard model, the use of absolute battle deaths, which usually is limited to a threshold, and a measure in per capita terms, which measures battle victims relative to the population size.
Assumptions of the impact of violence on growth
Amongst the devastating effects of conflict, one point of interest to the economist is the impact on economic growth. In the standard way of measuring conflict (the standard model) the marginal effect of a death on production per capita is assumed to be constant across time and units. The effect of an additional casualty is treated as independent from the population. In contrast, in the per capita approach the effect of one death on the economy is assumed to fall with population size.
Which assumptions are correct for the effects of violence on growth?
On the one hand, unpredictable violence could destabilize a government and the political process, therefore making it a public bad. In this case the standard model provides a reasonable approach, as the presence of conflict independent of population size would act as a public bad. On the other hand, localized violence in only a part of the country might be more realistically measured by evaluating the casualties relative to the population size.
How to measure civil war when identifying its causes?
Similar arguments apply to civil war as a dependent variable. In the standard model the individual likelihood to engage in violence needs to be inversely related to population size. In other words, the standard model is realistic if per capita conflict effort is decreasing in population. The free-rider problem within groups, for example, could reduce per capita effort in larger populations.
The standard model versus the per capita model – the empirical showdown
In order to understand how the two models affect results differently, Mueller runs a cross-country regression explaining economic growth, while controlling for country and year fixed effects. The 1000 death threshold dummy reduces growth by 2.8 percentage points, whereas dividing the civil war dummy by population size reveals considerable heterogeneity of the effects of civil war depending on the population. Growth in more populous countries reacts less to a conflict that exceeds 1000 battle-related casualties.
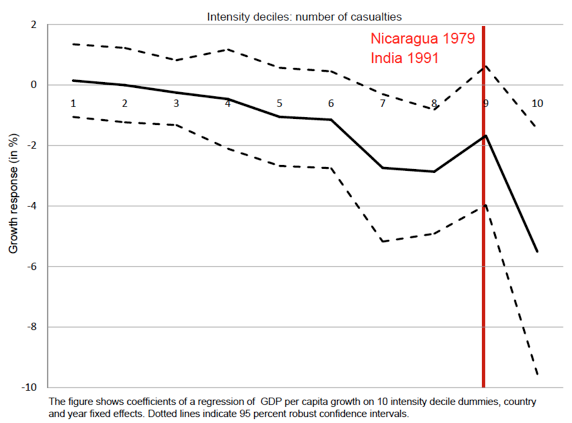
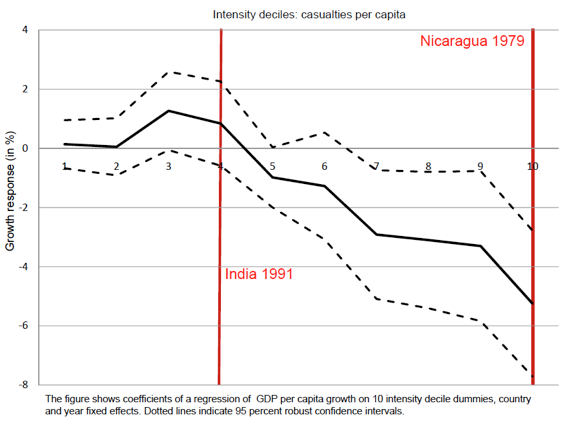
When the absolute measure is replaced by the per capita measure, a civil war is found to reduce growth by 3.5 percentage points. This increase is found to be even greater in a robustness check with a reduced sample only using data from after the end of the cold war. The difference between the impact of absolute and relative battle victims on growth becomes visibly apparent when looking at Figure 2 and 3, where growth is regressed on war intensity split into deciles in absolute and per capita terms, respectively. While India in 1991 and Nicaragua in 1979 both are in the ninth decile in absolute terms, in relative terms India is in the fourth and Nicaragua in the most intense decile. In the standard model both suffer a 2-percentage point decline in growth, which includes 0 in the confidence interval. However, in the per capita model India’s growth does not suffer, whereas the negative impact on Nicaragua’s growth exceeds 5 percentage points.


A call for theory
The results highlight how different measures can affect results. The author points out that much of the empirical literature on the causes and consequences of civil war has been remarkably silent about the mechanisms behind its empirical specifications. If the standard model is valid at the micro level, then aggregating more micro units will produce more violence rendering the standard model invalid at the country level. Given the current surge in disaggregated data these nuances have become even more important and exploitable. As a rule of thumb Mueller suggests that state-centered theories at the country level should use the standard model while economic/opportunity cost channels should use the per capita model.

